Monitor everything that matters
— don´t go nuts, go Almond!
Almond Monitor provides lightweight, extensible monitoring for servers, applications and containers using Nagios plugins allowing integrations through json API, metrics and Kafka streams.
NEWS
Almond Monitor 0.9.28 released on April 21, 2026.
Almond Monitor 0.9.28 now released with enhanced IAM and roles support.
A modernised look and feel for the admin page now is also part of the release.
Download Almond 0.9.28
A short video showing login option introduced in the previous release can be found below.
Almond Monitor 0.9.26 released on March 24, 2026.
The new version features a new push function in Almond with a responding receiver in the HowRU proxy functionality. In stead of relying on shared storage, Almond running in containers or as side cars could now push monitoring data and metrics directly to a HowRU endpoint.
A new feature in 0.9.26 is OTEL compability with endpoints and exporter available
in HowRU.
The release also includes minor buggfixes from prior releases.
This release is considered stable and recommended to all users of Almond.
Download Almond 0.9.26
About Almond Monitor
Almond Monitor is a modern monitoring solution that uses Nagios plugins to collect data and publishes the data collection is various ways.
Almond is an autonomous service that monitor a unit (server, hypervised server, docker container etc) where it is installed. It publish the data
collected in various ways, such as HTML, a prom-file, json, topics and through APIs.
Almond monitoring consists of two services, almond which uses Nagios plugins to collect monitoring data and howru that help publish the data.
The almond service has it´s own scheduler and various functions and can be used standalone. It can also produce all monitoring data to a Kafka topic.
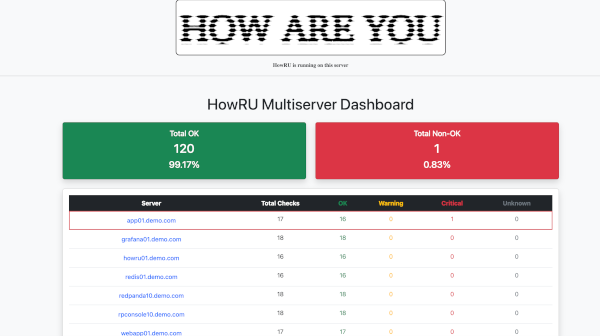
The howru service produce HTML and prometheus metrics and can be used as a proxy for data from several almond services.
Both services has API:s that return data as json.
If you currently use Nagios or its derivates, it might be time to move to Almond. Almond is a little bit like nrpe on steroids, and you can indeed use it as a direct replacement for nrpe or NCPA.
However, Almond is not directly linked to Nagios and can be used to integrate with other monitoring platforms. At the same time, if wished.
Core Features
A world of options
Export monitoring data as json, yaml or xml. Get data through API, metrics or as a Kafka consumer.
Flexible Integrations
Almond Monitor have json API:s that can be used to integrate with other monitoring solutions.
Monitor docker containers
With Almond you can monitor your docker containers as if they where ordinary servers, using an API proxy function.
Almond Monitor is an autonomous service running on units collecting monitoring data from Nagios plugins.
It does not provide a server GUI as most other monitoring systems, rather it aims at allowing integrations through its API.
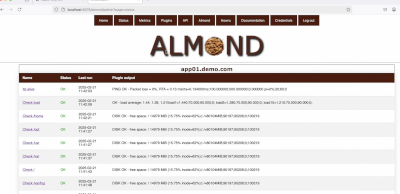
The unit running Almond Monitor will be able to show the results of the monitoring plugins through HTML, Json, metrics and
in Kafka topics.
Through a proxy function it can also display the data from several units in a single source.

Use Cases
Infrastructure Ops
Monitor everything you can monitor with Nagios, only much more flexible.
Docker container monitoring
Using howru proxy and API integrations make your containers look like ordinary servers in Nagios.
Low cost
Almond Monitoring is open source and free of charge.
There is almost no limit of usecases where Almond should not be regarded as interesting.
Whether you want to evaluate a new and modern monitoring tool for your business or improving your well established monitoring solution,
Almond should be an interesting option to look at.
If you are experienced with Nagios or its deriviates Almond would be a natural addition to your toolbox.
It can function as an alternative to nrpe, but adding additional options as API requests and metrics.
You can also use Almond as a Prometheus exporter for applications where no good Prometheus exporters are found.
You can use Almond to extract the metrics you really use from an exporter (maybe pack it with the metrics provided by Nagios plugins),
and let OpenTelemetry collect this data only, instead of a bunch of exporter metrics you do not use.
Through the API:s you can create your own customed monitoring scripts or integrate with other monitoring solutions.
Sending all monitoring data to Kafka topics can help you with future prediction or make nice data plots.
It also opens up to have different consumers reacting to your monitoring data.
Your options will be plenty using Almond Monitor, and at the top of it - Almond is free of charge.

Live Demo
Explore the demo
Try the demo to view Almond integrating with Nagios Core, Zabbix, Grafana, Redpanda and Prometheus. No install required, but you need to run docker.
Using the container from Docker hub you can check the product out by yourself and the demo from our GitHub will show a micro-service
running together with integrations with Prometheus, Grafana, Nagios Core, Kafka (Redpanda) and Zabbix.
We are also willing to demonstrate the capabilities of the product for you in a live demo as well as we are willing to help you getting
started working with the product.
Download
You can clone the entire Almond Monitor repo from GitHub or just grab the packages or source code from there to install Almond.
If you need any assistance getting started, feel free to contact us.

Contact
For demos or technical questions reach out and we'll get back to you promptly.


